Public Equity Performance

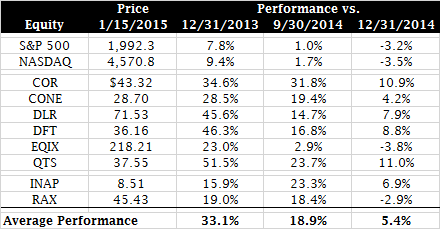
- Since the end of 2014, there has been quite a bit of volatility the US public equity markets. During that time, the S&P 500 and NASDAQ have declined 3.2% and 3.5%, respectively. That being said, since the end of 2014, last quarter, and last month, the average colocation and hosting equity has outperformed both the S&P 500 and the NASDAQ.
- Since the end of 2013, QTS was been the best performing publicly traded colocation/hosting equity with a share price appreciation of 51.5% versus 33.1% for the average colocation/hosting equity, 7.8% for the S&P 500, and 9.4% for the NASDAQ.
- Since the end of the 3rd Quarter of 2014, COR was the best performing publicly traded colocation/hosting equity with a share price appreciation of 31.8% versus 18.9% for the average colocation/hosting equity, 1.0% for the S&P 500, and 1.7% for the NASDAQ.
- Since the end of 2014, QTS was been the best performing publicly traded colocation/hosting equity with a share price appreciation of 11.0% versus 5.4% for the average colocation/hosting equity, -3.2% for the S&P 500 and -3.5% for the NASDAQ.
Public Equity Valuations as of January 15, 2015

- Market Cap
- As might be expected of the sector leader, EQIX had the highest market cap in our universe of publicly traded hosting and colocation equities.
- Enterprise Value (EV)
- Strong equity performance by DLR, and weak equity performance by EQIX allowed DLR to surpass EQIX as the company with the highest Enterprise Value in our universe of publicly traded hosting and colocation equities.
- EV/Revenue
- The companies in our coverage universe averaged an EV/LTM Revenue multiple of 7.1x and an EV/LQA Revenue of 6.6x.
- The companies in our coverage universe had a median EV/LTM Revenue multiple of 7.6x and a median EV/LQA Revenue multiple of 6.9x.
- With an EV/LTM Revenue multiple of 9.8x and an EV/LQA Revenue multiple of 9.4x, DLR was the most highly valued company in our coverage universe.
- With an EV/LTM Revenue multiple of 2.5x and an EV/LQA Revenue multiple of 2.4x, INAP was the least valuable company in our coverage universe.
- EV/EBITDA
- The companies in our coverage universe had an average EV/LTM EBITDA multiple of 14.8x and an EV/LQA EBITDA multiple of 14.0x.
- The companies in our coverage universe had a median EV/LTM EBITDA multiple of 14.1x and a median EV/LQA EBITDA multiple of 13.6x.
- With an EV/LTM EBITDA multiple of 20.0x and an EV/LQA EBITDA multiple of 19.0x, COR was the most highly valued company in our coverage universe.
- With an EV/LTM EBITDA multiple of 10.9x and an EV/LQA EBITDA multiple of 9.8x, INAP was the least valuable company in our coverage universe.
- Leverage
- The companies in our coverage universe averaged Total Debt/LTM EBITDA of 3.4x.
- The companies in our coverage universe had a median Total Debt/LTM EBITDA of 3.8x.
- With Total Debt/LTM EBIDA of 6.4x, COR was the most highly levered company in our coverage universe.
- With Total Debt/LTM EBITDA of 0.2x, RAX was the least levered company in our coverage universe.
Note:
- EV = Equity Value + Total Debt – Cash
- Net Debt = Total Debt – Cash
- LTM – Last Twelve Months
- LQA – Last Quarter Annualized
If you enjoyed this post, make sure you subscribe to my RSS feed!

Leave a Reply
You must be logged in to post a comment.