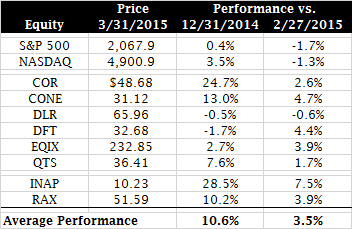
Public Equity Performance as of March 31, 2015

- Since the end of 2014, there has been quite a bit of volatility the US public equity markets. During that time, the S&P 500 and NASDAQ are up 0.4% and 3.5%, respectively. That being said, since the end of 2014, the average colocation and hosting equity is up 10.6%, outperforming both the S&P 500 and the NASDAQ, with COR, CONE, and INAP outperforming their peer group.
- Since the end of 2014, INAP was been the best performing publicly traded colocation/hosting equity, with a share price appreciation of 28.5%.
- Since the end of February, 2015, the S&P 500 and NASDAQ are down 1.7% and 1.3%, respectively. During that period, the average colocation and hosting equity is up 3.5%, with CONE, DFT, EQIX, INAP, and RAX outperforming their peer group.
- Since the end of February, INAP was been the best performing publicly traded colocation/hosting equity, with a share price appreciation of 7.5%.
Public Equity Valuations as of March 31, 2015

- Market Cap
- As might be expected of the sector leader, EQIX had the highest market cap in our universe of publicly traded hosting and colocation equities.
- Enterprise Value (EV)
- As might be expected of the company with the highest market cap in the sector, EQIX had the highest Enterprise Value in our universe of publicly traded hosting and colocation equities.
- EV/Revenue
- The companies in our coverage universe averaged an EV/LTM Revenue multiple of 7.3x and an EV/LQA Revenue of 6.8x.
- The companies in our coverage universe had a median EV/LTM Revenue multiple of 7.6x and a median EV/LQA Revenue multiple of 7.1x.
- With an EV/LTM Revenue multiple of 10.0x and an EV/LQA Revenue multiple of 9.4x, COR was the most highly valued company in our coverage universe.
- With an EV/LTM Revenue multiple of 2.7x and an EV/LQA Revenue multiple of 2.7x, INAP was the least highly valued company in our coverage universe.
- EV/EBITDA
- The companies in our coverage universe had an average EV/LTM EBITDA multiple of 15.1x and an EV/LQA EBITDA multiple of 14.1x.
- The companies in our coverage universe had a median EV/LTM EBITDA multiple of 15.2x and a median EV/LQA EBITDA multiple of 14.8x.
- With an EV/LTM EBITDA multiple of 20.5x and an EV/LQA EBITDA multiple of 18.8x, COR was the most highly valued company in our coverage universe.
- With an EV/LTM EBITDA multiple of 11.6x and an EV/LQA EBITDA multiple of 10.1x, INAP was the least highly valued company in our coverage universe.
- Leverage
- The companies in our coverage universe averaged Total Debt/LTM EBITDA of 3.8x and Net Debt/LTM EBITDA of 3.3x
- The companies in our coverage universe had a median Total Debt/LTM EBITDA of 4.0x and a median Net Debt/LTM EBITDA of 3.4x.
- With Total Debt/LTM EBIDA of 6.4x and Net Debt/LTM EBITDA of 6.3x, QTS was the most highly levered company in our coverage universe.
- With Total Debt/LTM EBITDA of 0.3x, and a Net Debt position of -0.1x (net cash), RAX was the least levered company in our coverage universe.
Note:
- EV = Equity Value + Total Debt – Cash
- Net Debt = Total Debt – Cash
- LTM – Last Twelve Months
- LQA – Last Quarter Annualized
If you enjoyed this post, make sure you subscribe to my RSS feed!

Leave a Reply
You must be logged in to post a comment.